 |
|
|
| Main Page |
| 10.1 Purpose and Background |
| 10.2 Try it out |
| 10.3 Generate a large surface |
| 10.4 Hints |
| 10.5 Solutions |
10.0 Shape Visualizer Advanced Practical
10.1 Purpose and Background
The goal of this tutorial is twofold. First, you will gain some experience with submitting a real Java program similar to the one that you'll use for the Condor integrating practical next Thursday (assuming you choose the Condor path). Second, you will have a chance to try out your new Condor skills in running a slightly more realistic application.
The application is a very simple one. Imagine a three-dimensional surface or topographical map. You can discover the features of this map with an application that samples the surface at different points, and then you can visualize the data that it provides. The process to examine the data and create the map is very fast, but it's similar in operation to a real application, which would usually be much slower.
10.2 Try it out
Let's try it out on the command-line before we run it in Condor. First, download some Java code and a sample Condor submit file:
> cd
> wget www.gs.unina.it/~condor/condor-adv.tar.gz
> tar xzf condor-adv.tar.gz
> cd condor-adv
> ls
condor_shapes.jar  submit.java
The two-dimensional surface is location between (0,0) and (100,100). We can visualize a subset of the surface by specifying the subset we want and the number of points we use in the visualization. There is a maximum of 2000 points, to encourage you to use multiple Condor jobs.
First, sample the surface and make sure it worked:
> java -cp condor_shapes.jar uk.ac.nesc.training.sfk.RegularExplorer 0 0 10 10 2000 out.dat
> head -5 out.dat
0.11363636363636363 0.11363636363636363 41.2
0.11363636363636363 0.3409090909090909 41.2
0.11363636363636363 0.5681818181818181 41.2
0.11363636363636363 0.7954545454545454 41.2
0.11363636363636363 1.0227272727272727 41.2
Now visualize it:
> > gnuplot

        G N U P L O T
        Version 3.7 patchlevel 3
        last modified Thu Dec 12 13:00:00 GMT 2002
        System: Linux 2.4.21-27.0.2.EL.cernsmp

        Copyright(C) 1986 - 1993, 1998 - 2002
        Thomas Williams, Colin Kelley and many others

        Type `help` to access the on-line reference manual
        The gnuplot FAQ is available from
        http://www.gnuplot.info/gnuplot-faq.html

        Send comments and requests for help to
        Send bugs, suggestions and mods to


Terminal type set to 'x11'
gnuplot> splot "out.dat"
Warning: empty z range [41.2:41.2], adjusting to [40.788:41.612]
gnuplot>
It should pop up an image like this:
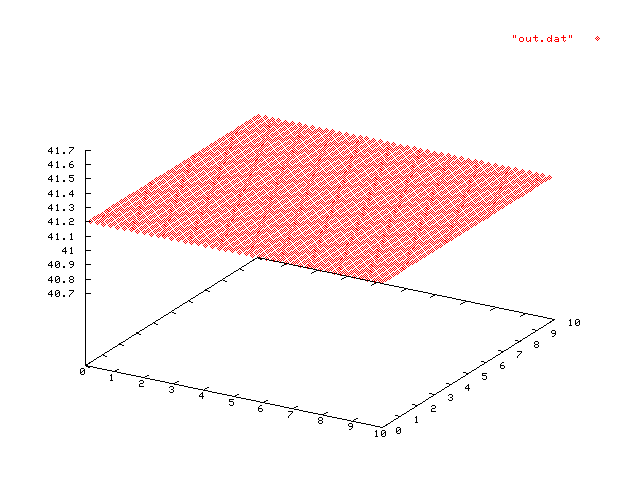
It's not terribly interesting because we chose a boring part of the
image to look at.
When you are done with gnuplot, you can either use control-D or "quit" to exit the program.
Now run your program with Condor. You should just be able to submit submit.java to Condor. It looks like this:
Universe   = java
Executable = condor_shapes.jar
jar_files  = condor_shapes.jar
Arguments  = uk.ac.nesc.training.sfk.RegularExplorer 0 0 10 10 2000
Log        = explorer.log
Output     = explorer.output
Error      = explorer.error
Note that condor_shapes.jar is listed for the executable and the jar_files. It's weird, I know.
When Condor runs this, you should get similar output to running it by hand.
10.3 Generate a large surface
Here's your task: Run this program 100 times, and each time, cover a 10x10 square of the surface. For example, you might run:
- (0, 0) -> (10, 10)
- (0, 10) -> (10, 20)
- (0, 20) -> (10, 30)
- ...
When you are done, you should combine all of the data files into a single file, then plot it with gnuplot. If you want to have a more permanent record of what you see with gnuplot, you can do:
> gnuplot
> set terminal postscript
> set output "graph.ps"
> splot "input.dat"
10.4 Hints
Option 1: You can write a single submit file to submit 100 jobs. Learn about the $(Process) macro to minimize your work. You might want to write a small bash/Java/C program to write the submit file for you.
Option 2: Do this with a DAG: Make a hundred small jobs, again writing them with a small program to simplify it. Then write a script to collate the data and feed to to gnuplot. Make a DAG where these 100 jobs are parents of the child DAG. This solution is more complex and a bit slower to run, so it's not as useful if your only goal is to solve this exercise. On the other hand, DAGs are rather useful when running real jobs that depend on each other, so this exercise is useful in helping you you learn DAGMan better.
10.5 Solutions
Please do not look at the solutions until you've tried hard to make it
work yourself. But if you're having real difficulties or you want to
compare your solution with mine, feel free to check these out:
Solution 1
Solution 2
Next: Condor challenges (Only if you have time)
|
|